INFOGRAPHIC: The periodic table of commodity returns
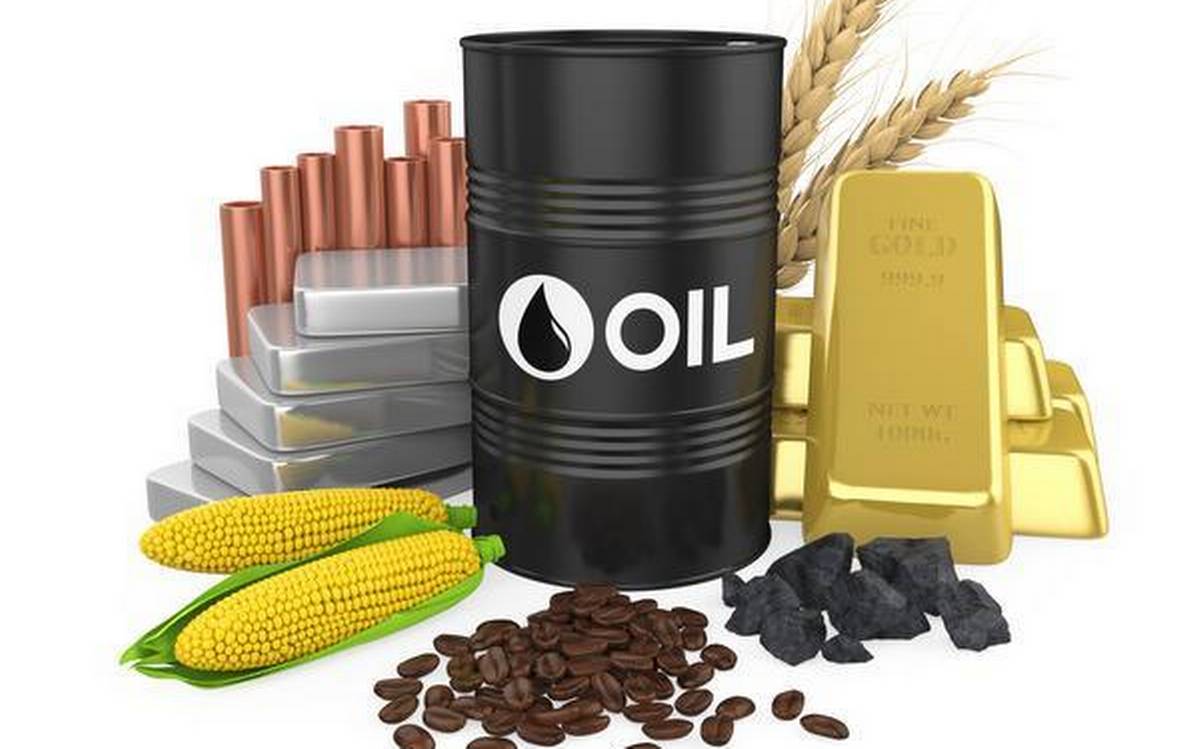

That said, the lack of an obvious correlation in commodity markets also makes for a thought-provoking and humbling exercise: comparing the annual returns of commodities against the data from the past decade.
A decade of commodities (2010-2019)
Today’s visualization comes to us from U.S. Global Investors, and it compares individual commodity returns between 2010 and 2019.
You can use the interactive tool on their website to toggle between various settings for the table of commodity returns, such as breaking them down by category (i.e. energy, precious metals, etc.), by best and worst performers, or by volatility over the time period.
Let’s dive into the data to see what trends we can uncover.
Palladium: the best commodity, three years straight
In 2019, palladium finished as the best performing commodity for the third straight year — this time, with a 54.2% return.
You could have bought the precious metal for about $400/oz in early 2010, when it was a fraction of the price of either gold or platinum.
Nowadays, thanks to the metal’s ability to reduce harmful car emissions and an uncertain supply situation, palladium trades for above $2,000/oz — making it more expensive per ounce than both gold and platinum.
Oil and gas: opposite ends of the spectrum
As key energy commodities, oil and natural gas have an inherent connection to one another.
However, in 2019, the two commodities had completely diverging performances:
Crude oil prices gained 34.5% on the year, making it one of the best commodities for investors — meanwhile, natural gas went the opposite direction, dropping 25.5% on the year. This actually cements gas as the worst performing major commodity of the decade.
“That’s gold, Jerry!”
Finally, it’s worth mentioning that gold and silver had a bounceback year.
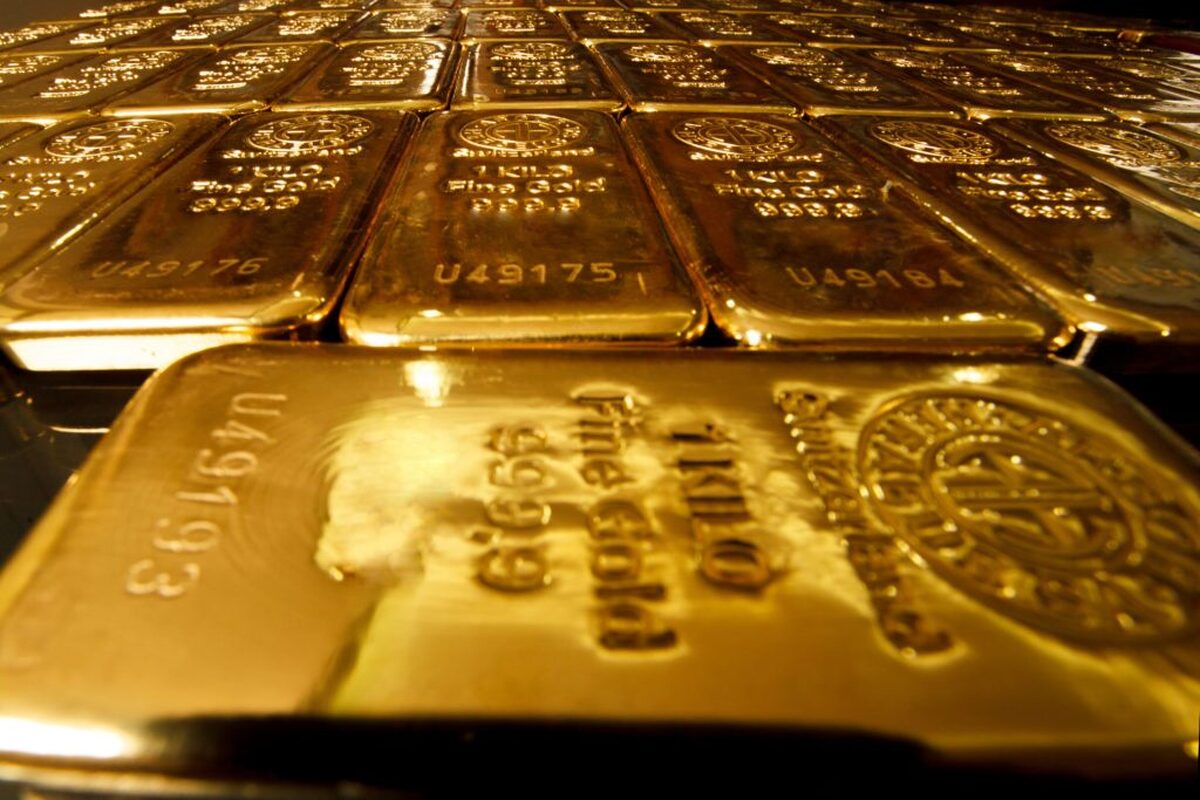
Gold gained 18.3% to finish with the best return the yellow metal has seen in a decade. Silver followed suit with a similar story, rallying 15.2% over the calendar year.
Precious metals now sit at multi-year highs against an interesting economic and geopolitical backdrop to start 2020.
Where do you see the above commodities ending up on next year’s edition of the rankings?
(By Jeff Desjardins)


Gold price edges up as market awaits Fed minutes, Powell speech

Glencore trader who led ill-fated battery recycling push to exit
Emirates Global Aluminium unit to exit Guinea after mine seized
Iron ore price dips on China blast furnace cuts, US trade restrictions

Roshel, Swebor partner to produce ballistic-grade steel in Canada

Trump weighs using $2 billion in CHIPS Act funding for critical minerals

US hikes steel, aluminum tariffs on imported wind turbines, cranes, railcars

EverMetal launches US-based critical metals recycling platform

Afghanistan says China seeks its participation in Belt and Road Initiative

Energy Fuels soars on Vulcan Elements partnership
Northern Dynasty sticks to proposal in battle to lift Pebble mine veto

Giustra-backed mining firm teams up with informal miners in Colombia

Critical Metals signs agreement to supply rare earth to US government-funded facility

China extends rare earth controls to imported material

Galan Lithium proceeds with $13M financing for Argentina project
Silver price touches $39 as market weighs rate cut outlook
First Quantum drops plan to sell stakes in Zambia copper mines

Ivanhoe advances Kamoa dewatering plan, plans forecasts

Texas factory gives Chinese copper firm an edge in tariff war

Energy Fuels soars on Vulcan Elements partnership

Northern Dynasty sticks to proposal in battle to lift Pebble mine veto

Giustra-backed mining firm teams up with informal miners in Colombia

Critical Metals signs agreement to supply rare earth to US government-funded facility

China extends rare earth controls to imported material

Galan Lithium proceeds with $13M financing for Argentina project

Silver price touches $39 as market weighs rate cut outlook

First Quantum drops plan to sell stakes in Zambia copper mines

Ivanhoe advances Kamoa dewatering plan, plans forecasts

