Phosphates: Argus launches daily phosphate pricing

The first report was published on 16 March and will initially be made available to subscribers of the Argus phosphates service.
"The move reflects accelerating trends in market activity across the phosphate trading space," senior vice president, fertilizers, Lauren Williamson said. "Increased assessment frequency will provide more robust pricing, both on a daily basis and in the calculation of price averages across a certain period that may be used in contract negotiation or formula price agreements."
The prices assessed are the most liquid and represent a substantial part of global trade in DAP and MAP. The prices to be published will comprise:
DAP fob China
DAP cfr India
MAP cfr Brazil
DAP barges fob Nola
MAP barges fob Nola
China is the world's largest DAP exporter, shipping nearly 6.5mn t in 2019, according to GTT data. It represents around 40pc of global exports, following rapid investment in capacity since the early 2000s in order to make China self-sufficient. The price feeds directly into the Indian DAP cfr price, the largest importer of DAP globally. In 2019, it took 5.7mn t of DAP, of which China accounted for just over 40pc.
Although there is increased seasonal trade between the two countries from April each year as the Indian domestic market ramps up and the Chinese domestic market winds down, these markets remain highly liquid throughout the year through spot trades, individually priced contract shipments against supply agreements and purchase tenders.
Similarly, Brazil is the world's premier importer of MAP, taking 3.9mn t in 2019 according to GTT, roughly a third of all trade. The market is the barometer of MAP prices west of Suez and impacts directly on MAP fob levels in supplying nations, including Morocco, the US, Russia, China and Saudi Arabia.
The US is one of the most mature and well-developed phosphate markets in the world. DAP and MAP prices in New Orleans are reference prices for the domestic market and are keenly examined by global producers looking to export phosphates to the US, as well as by US producers.
In 2019, the US imported 1.9mn t of MAP and 1.2mn t of DAP, and is a vital outlet for Russian and Moroccan suppliers in particular. There is also a relationship between US domestic and Brazilian cfr prices as exporters weigh the relative netbacks from each when deciding where to ship MAP west. Similarly, Brazilian importers frequently cite values in the US market in price negotiations.


Trump weighs using $2 billion in CHIPS Act funding for critical minerals
Codelco cuts 2025 copper forecast after El Teniente mine collapse
Electra converts debt, launches $30M raise to jumpstart stalled cobalt refinery

Barrick’s Reko Diq in line for $410M ADB backing
Abcourt readies Sleeping Giant mill to pour first gold since 2014
Nevada army depot to serve as base for first US strategic minerals stockpile
SQM boosts lithium supply plans as prices flick higher
Viridis unveils 200Mt initial reserve for Brazil rare earth project
Tailings could meet much of US critical mineral demand – study
Kyrgyzstan kicks off underground gold mining at Kumtor
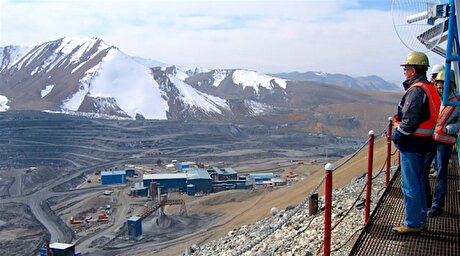
Kyrgyzstan kicks off underground gold mining at Kumtor
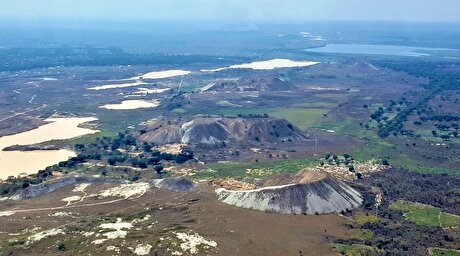
KoBold Metals granted lithium exploration rights in Congo
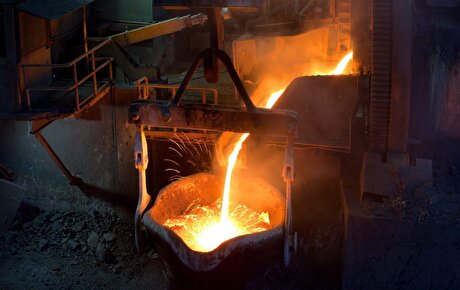
Freeport Indonesia to wrap up Gresik plant repairs by early September
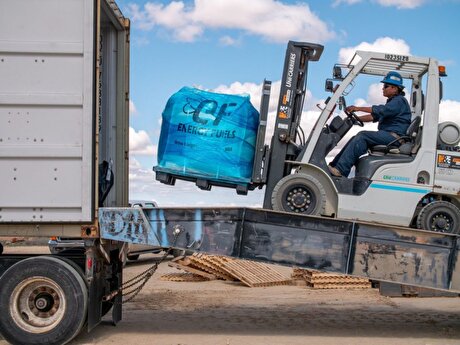
Energy Fuels soars on Vulcan Elements partnership
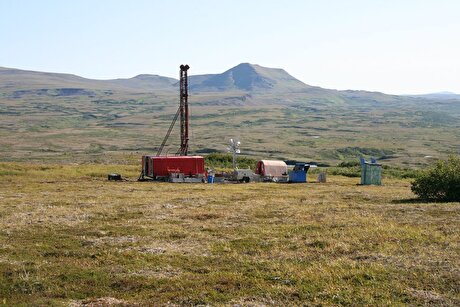
Northern Dynasty sticks to proposal in battle to lift Pebble mine veto

Giustra-backed mining firm teams up with informal miners in Colombia

Critical Metals signs agreement to supply rare earth to US government-funded facility

China extends rare earth controls to imported material
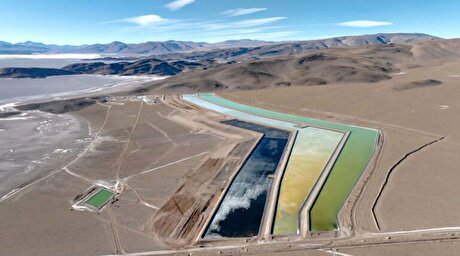
Galan Lithium proceeds with $13M financing for Argentina project

Kyrgyzstan kicks off underground gold mining at Kumtor

Freeport Indonesia to wrap up Gresik plant repairs by early September

Energy Fuels soars on Vulcan Elements partnership

Northern Dynasty sticks to proposal in battle to lift Pebble mine veto

Giustra-backed mining firm teams up with informal miners in Colombia

Critical Metals signs agreement to supply rare earth to US government-funded facility

China extends rare earth controls to imported material

Galan Lithium proceeds with $13M financing for Argentina project
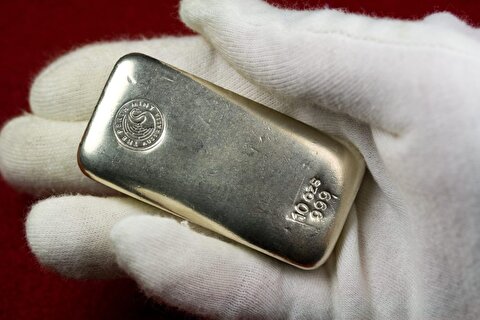
Silver price touches $39 as market weighs rate cut outlook
