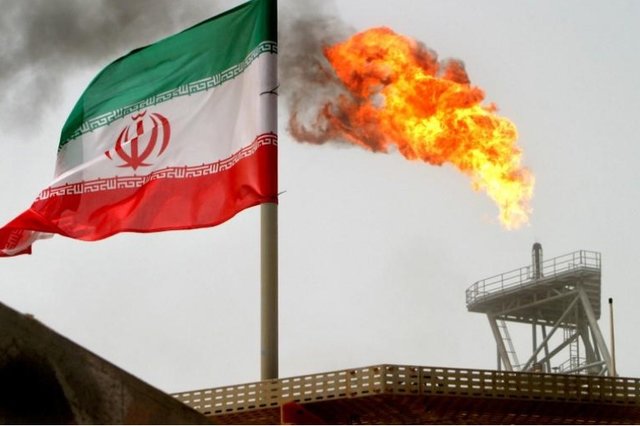
China's crude imports from Iran rise 5%

GAC releases data in metric tons, which S&P Global Platts converts to barrels using a 7.33 conversion factor, Platts reported.
In metric-ton basis, Iranian inflows rose 8.2% to 926,119 mt from June, but dropped 71.9% year on year.
Meanwhile, crude oil imports from the US jumped 45% year on year to 1.53 million mt. This was the first time since August 2018 for the supplier to be in the top 10 list.
Supply from Saudi Arabia, on the other hand, surged 115.9% year on year to 6.99 million mt, or 1.65 million bpd, in July, despite falling from the all-time high of 1.89 million bpd in June.
As a result, the kingdom became the top crude supplier to China in both July and the first seven months of the year.
During January-July, China imported 162.27 million mt of crude from OPEC, up 10.4% year on year.
Supplies from the Middle East and South America also gained 9% and 11.3% year on year during January-July, respectively.
However, volumes from North America plunged 59.8% year on year to 4.2 million mt in the first seven months due to lesser US crude inflows earlier this year.


Gold price edges up as market awaits Fed minutes, Powell speech

Glencore trader who led ill-fated battery recycling push to exit

Emirates Global Aluminium unit to exit Guinea after mine seized

UBS lifts 2026 gold forecasts on US macro risks

Iron ore price dips on China blast furnace cuts, US trade restrictions

Roshel, Swebor partner to produce ballistic-grade steel in Canada

EverMetal launches US-based critical metals recycling platform

US hikes steel, aluminum tariffs on imported wind turbines, cranes, railcars

Afghanistan says China seeks its participation in Belt and Road Initiative

First Quantum drops plan to sell stakes in Zambia copper mines

Ivanhoe advances Kamoa dewatering plan, plans forecasts

Texas factory gives Chinese copper firm an edge in tariff war

Pan American locks in $2.1B takeover of MAG Silver

Iron ore prices hit one-week high after fatal incident halts Rio Tinto’s Simandou project

US adds copper, potash, silicon in critical minerals list shake-up

Barrick’s Reko Diq in line for $410M ADB backing

Gold price gains 1% as Powell gives dovish signal

Electra converts debt, launches $30M raise to jumpstart stalled cobalt refinery

Gold boom drives rising costs for Aussie producers

First Quantum drops plan to sell stakes in Zambia copper mines

Ivanhoe advances Kamoa dewatering plan, plans forecasts

Texas factory gives Chinese copper firm an edge in tariff war

Pan American locks in $2.1B takeover of MAG Silver

Iron ore prices hit one-week high after fatal incident halts Rio Tinto’s Simandou project

US adds copper, potash, silicon in critical minerals list shake-up

Barrick’s Reko Diq in line for $410M ADB backing

Gold price gains 1% as Powell gives dovish signal

Electra converts debt, launches $30M raise to jumpstart stalled cobalt refinery


