Russia: Ferro Silicon Imports Hits 4 years High in CY 18
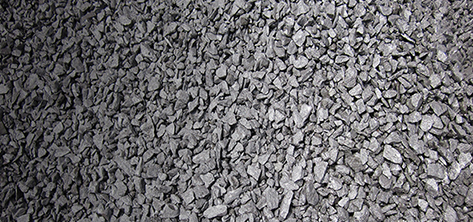
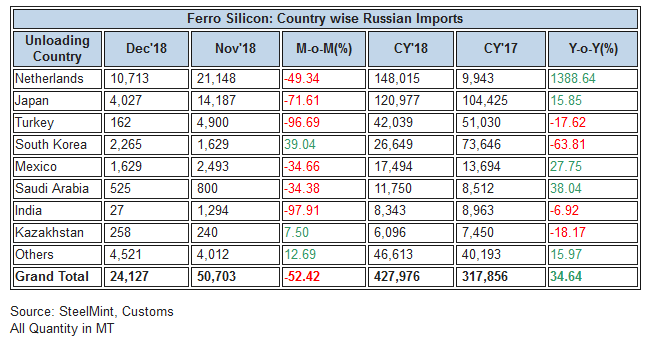
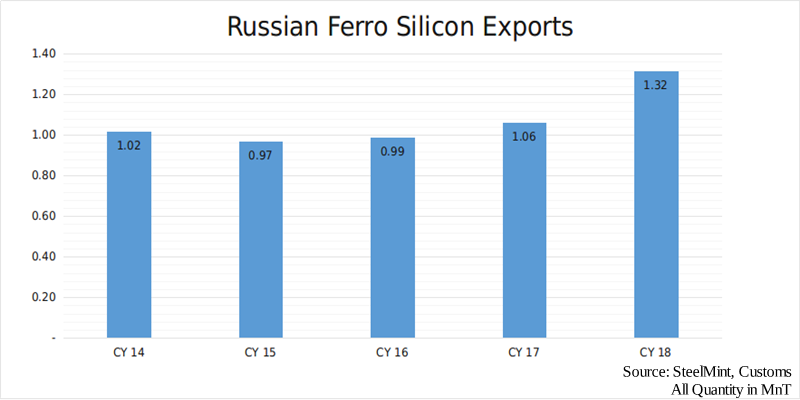
Russian Ferro Silicon Exports went 4 years high in CY18. Ferro Silicon exports were increased from 427,976MT in CY18 to 317,856MT in CY17 which accounted for 34.64% hike. Meanwhile in Dec’18, the exports sunk by 52.42% M-o-M. Exports in Dec’18 were 24,127MT.
Netherlands, Japan and Turkey remained the top three importers of Russian Ferro Silicon. Netherlands accounted for 35% shares in total Ferro Silicon imports for Russia. Meanwhile, Japan and Turkey contributed 28% and 10% of the total shares respectively.
Netherlands showed a remarkable hike in imports from Russia in CY18 as the quantity increased from 9,943MT in CY17 to 148,015MT in CY18. However, the imports were much lower in Dec’18 by 49.34%. Japan and Turkey too experienced a substantial fall by 70.61% and 96.69% respectively. However, this fall doesn’t seem to affect much in the total growth rate of imports by Japan from Russia which showed a increase by 15.85%.
In Dec’18, Turkey, India, Mexico and Saudi Arabia lowered their imports owing to much lesser demand and stalemate conditions of Steel Market. The fall in Imports for Turkey were 96.69% in Dec’18 M-o-M. Meanwhile, the imports from from India were substantially low by 97.71% M-o-M and Marginally low on Y-o-Y basis by 6.92%.


Uzbek gold miner said to eye $20 billion value in dual listing

Peabody–Anglo $3.8B coal deal on the brink after mine fire

A global market based on gold bars shudders on tariff threat
Minera Alamos buys Equinox’s Nevada assets for $115M
SSR Mining soars on Q2 earnings beat
Century Aluminum to invest $50M in Mt. Holly smelter restart in South Carolina
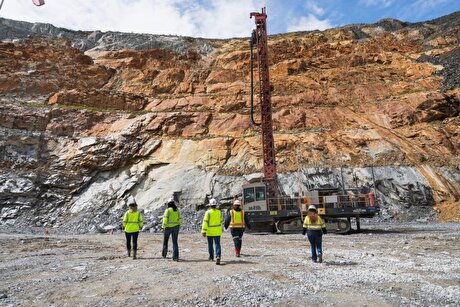
OceanaGold hits new high on strong Q2 results

Australia to invest $33 million to boost Liontown’s Kathleen lithium operations

China limits supply of critical minerals to US defense sector: WSJ
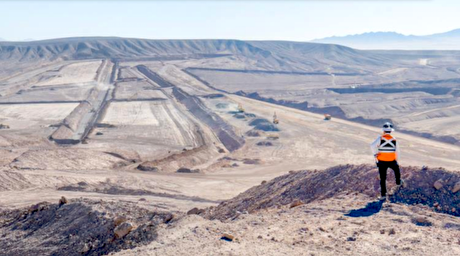
Antofagasta posts biggest profit margins since 2021
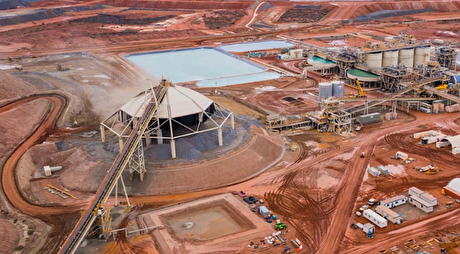
Gold Fields nears $2.4B Gold Road takeover ahead of vote

US startup makes thorium breakthrough at Department of Energy’s Idaho National Lab
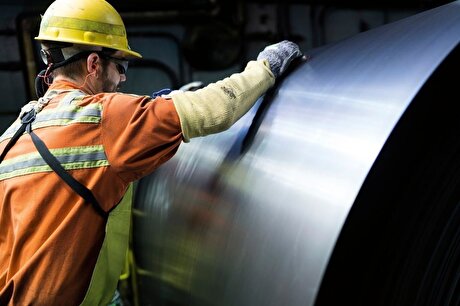
Cleveland-Cliffs inks multiyear steel pacts with US automakers in tariff aftershock

Bolivia election and lithium: What you need to know

Samarco gets court approval to exit bankruptcy proceedings
US eyes minerals cooperation in province home to Reko Diq

Allegiant Gold soars on 50% financing upsize
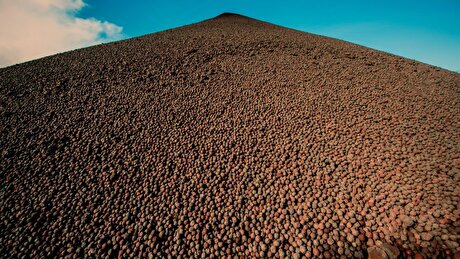
Explaining the iron ore grade shift

Metal markets hold steady as Trump-Putin meeting begins

Antofagasta posts biggest profit margins since 2021

Gold Fields nears $2.4B Gold Road takeover ahead of vote

US startup makes thorium breakthrough at Department of Energy’s Idaho National Lab

Cleveland-Cliffs inks multiyear steel pacts with US automakers in tariff aftershock

Bolivia election and lithium: What you need to know

Samarco gets court approval to exit bankruptcy proceedings

US eyes minerals cooperation in province home to Reko Diq

Allegiant Gold soars on 50% financing upsize

Explaining the iron ore grade shift

