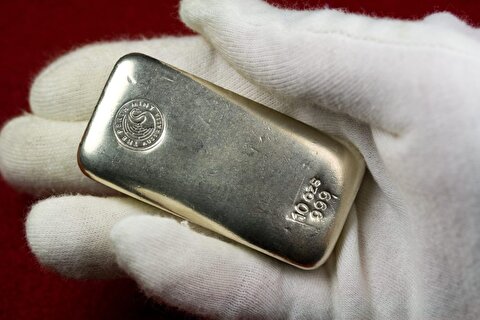
Funds trim net-bullish gold positioning but increase silver net length
During the week-long period to March 31 covered by the last CFTC report, June gold lost $66.70 to $1,596.60 an ounce, while May silver slipped 10.1 cents to $14.156.
Net long or short positioning in CFTC data reflect the difference between the total number of bullish (long) and bearish (short) contracts. Traders monitor the data to gauge the general mood of speculators, although excessively high or low numbers are viewed by many as signs of overbought or oversold markets that may be ripe for price corrections.
The CFTC’s “disaggregated” report showed that money managers trimmed their net-long position in gold to 152,598 futures contracts from 157,409 the week before. The decline was due to a combination of long liquidation (gross longs fell by 2,145 contracts) and fresh selling (gross shorts rose by 2,666 lots).
“The surge in the USD [U.S. dollar], as many fund mangers sold risk assets to fund redemptions and cover margins, contributed to a heavy reduction in gold longs,” said a research note from TD Securities. “Continued volatility in the gold market and a blowout in the physical-futures differentials also prompted money managers to aggressively cut their long exposure and their participation in the futures market.”
Commerzbank analyst Carsten Fritsch pointed out that the decline in net length among futures traders comes at a time when investors have been piling into gold exchange-traded funds. For the week ending Friday, gold ETF holdings rose by 47 metric tons.
“Speculators are remaining reticent, on the other hand; net-long positions stagnated at a comparatively low level for the third week in a row,” he said.
Meanwhile, money managers upped their their net-bullish stance in silver to a net long of 17,974 futures contracts from 14,011 the week before. The rise was mostly due to short covering, as gross shorts fell by 3,795 lots. There was a modest increase of 168 total longs.


Trump weighs using $2 billion in CHIPS Act funding for critical minerals

Codelco cuts 2025 copper forecast after El Teniente mine collapse

Electra converts debt, launches $30M raise to jumpstart stalled cobalt refinery

Barrick’s Reko Diq in line for $410M ADB backing

Abcourt readies Sleeping Giant mill to pour first gold since 2014

Nevada army depot to serve as base for first US strategic minerals stockpile

SQM boosts lithium supply plans as prices flick higher

Viridis unveils 200Mt initial reserve for Brazil rare earth project

Tailings could meet much of US critical mineral demand – study

Kyrgyzstan kicks off underground gold mining at Kumtor

Kyrgyzstan kicks off underground gold mining at Kumtor

KoBold Metals granted lithium exploration rights in Congo

Freeport Indonesia to wrap up Gresik plant repairs by early September

Energy Fuels soars on Vulcan Elements partnership

Northern Dynasty sticks to proposal in battle to lift Pebble mine veto

Giustra-backed mining firm teams up with informal miners in Colombia

Critical Metals signs agreement to supply rare earth to US government-funded facility

China extends rare earth controls to imported material

Galan Lithium proceeds with $13M financing for Argentina project

Kyrgyzstan kicks off underground gold mining at Kumtor

Freeport Indonesia to wrap up Gresik plant repairs by early September

Energy Fuels soars on Vulcan Elements partnership

Northern Dynasty sticks to proposal in battle to lift Pebble mine veto

Giustra-backed mining firm teams up with informal miners in Colombia

Critical Metals signs agreement to supply rare earth to US government-funded facility

China extends rare earth controls to imported material

Galan Lithium proceeds with $13M financing for Argentina project

Silver price touches $39 as market weighs rate cut outlook


